
Key Takeaways
- Treat the Google Ads account itself as the unit of management: one architecture, one conversion taxonomy, and one compliance posture, with service-line campaigns and location-aware ad groups layered on top.
- Order location decisions correctly—catchment-area logic defines the realistic service boundary, geo-targeting translates that into platform settings, and geofencing applies surgical perimeter tactics; radii should match actual patient drive-time data, not default rings.
- Target at the ad group and tailor at the landing page, while enforcing HIPAA authorization rules 1and FTC claims substantiation 2as account-level controls rather than per-location checklists.
- Make booked and kept appointments the unit of truth through offline conversion import, location-level call tracking, and defined lag windows—then consolidate agency stacks into a unified model once coordination cost outpaces portfolio intelligence, typically past 10–20 sites.
Why per-location PPC stops scaling past a dozen sites
Local PPC breaks at scale not because the tactics stop working, but because the management model was never designed for a portfolio. A dermatology group running three clinics can absorb the coordination cost of three campaign builds, three sets of negative keyword lists, and three weekly reports. The same group at thirty clinics inherits a different problem entirely: thirty parallel agency relationships, thirty conversion taxonomies that drifted apart over time, and thirty separate compliance review surfaces. The work stops being marketing and starts being reconciliation.
The math compounds quickly. Each new site adds linear ad-ops labor but multiplies the surface area for inconsistency. One location reports calls as a conversion. Another counts form fills only. A third imports appointments from the EHR but defines "new patient" differently than the regional director assumed. When the VP of Marketing asks a basic question—cost per booked appointment by service line across the footprint—no clean answer exists, because no one designed for that question at the account level.
Patient journeys make this worse. A Google–Compete study cited in private practice marketing research found that 48% of patients spent over two weeks researching providers before booking 6. That research window crosses devices, locations, and ad groups. Attribution that lives inside a single location's campaign cannot see it.
The fix is not better per-location execution. It is treating the account itself as the unit of management: one architecture, one conversion definition, one compliance posture, and location-aware targeting layered on top. Everything that follows in this article assumes that reframing. Per-location PPC is not wrong at small scale—it simply does not survive contact with a real multi-site footprint.
Account architecture as the operating model
One account, service-line campaigns, location-aware ad groups
The structural decision that determines whether local PPC scales is where the account boundary gets drawn. A single Google Ads account, organized by service line at the campaign level, with location targeting applied at the ad group level, produces a footprint a regional director can actually read. The inverse — one account per location, or one account per agency relationship — creates a portfolio that no one can compare across.
Service-line campaigns isolate budget and bidding logic by the thing patients actually search for. An urgent care chain running campaigns for "walk-in care," "occupational health," and "pediatric urgent care" can shift spend between service lines as demand moves, without rebuilding location-by-location structures. Location-aware ad groups underneath each campaign carry the geo-target, the location-specific ad copy, the call extension routed to that site's front desk, and the URL pointing to that site's landing page. The campaign decides the service. The ad group decides the site.
This architecture also standardizes what a funnel looks like at the unit level. A study of paid digital ads supporting an early psychosis intervention program reported 191,313 impressions, 4,350 clicks at a $0.33 cost per click, and 1% of users contacting the local program — a single help-seeking clinical context with a narrow scope, not a benchmark for dermatology or urgent care 3. The value of that funnel for a multi-location operator is not the absolute numbers. It is the structural pattern: impressions, clicks, cost per click, and contact rate measured against a defined local endpoint. When every ad group in the account reports against the same four-stage shape, regional comparisons become honest. When each location's agency tracks a different endpoint, they do not.
Shared layers: negatives, naming, conversion taxonomy
Three shared layers sit underneath the campaign-and-ad-group structure and determine whether the account behaves as one system or thirty.
- Negative keyword lists live at the account level, not the campaign level. A behavioral health network blocking employment-related queries, insurance-claim queries, or competitor brand terms applies that list once and inherits the exclusion across every campaign and ad group. The alternative — thirty location campaigns each maintaining their own negative lists — guarantees drift and wasted spend on terms the regional team already disqualified.
- Naming conventions are the second layer. A consistent pattern such as ServiceLine_Region_Location_MatchType at the campaign and ad group level lets analysts filter the entire account by service line, region, or location in seconds. Inconsistent naming forces manual reconciliation every time leadership asks a portfolio question.
- Conversion taxonomy is the third and most consequential. One conversion definition for "booked appointment," one for "qualified call," one for "form lead," applied identically at every location, makes cost-per-appointment comparable across the footprint. When locations define conversions independently, the reporting layer reports noise. Standardizing taxonomy at the account level is the precondition for every measurement decision in the sections that follow.
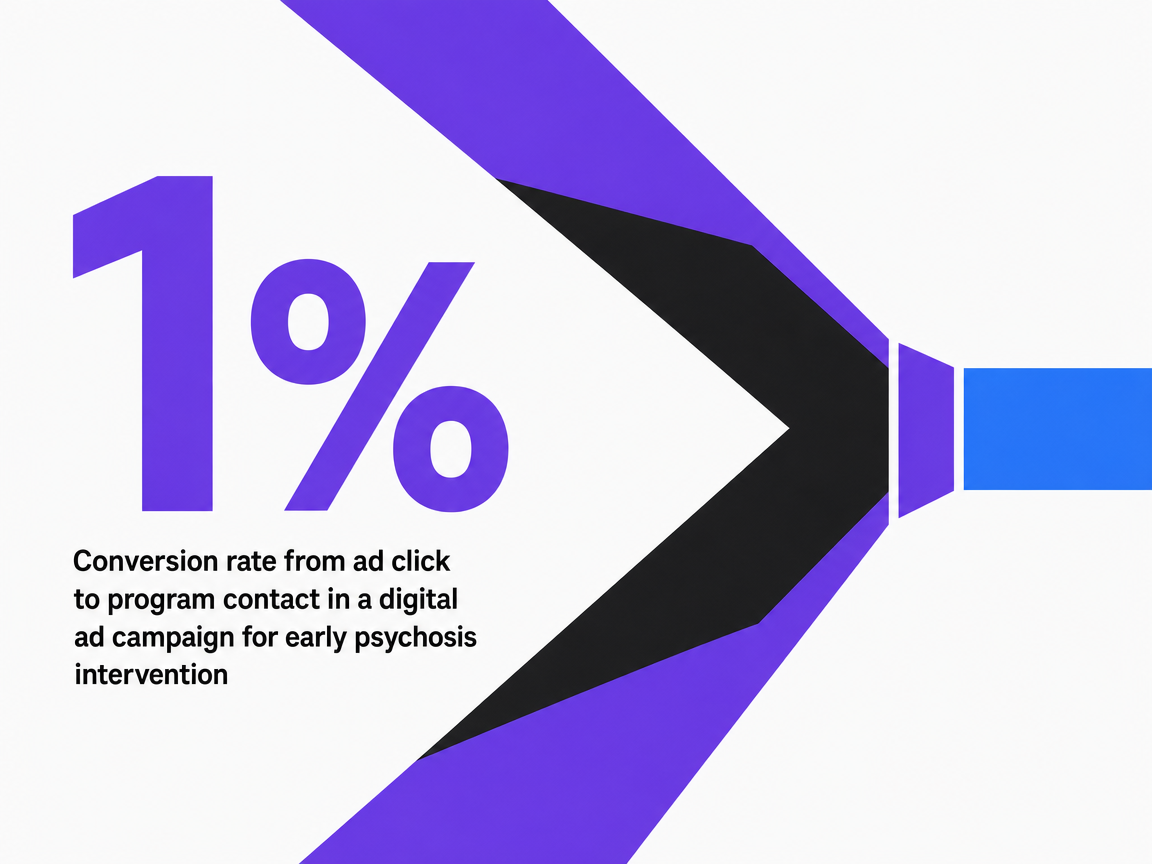 Conversion rate from ad click to program contact in a digital ad campaign for early psychosis intervention
Conversion rate from ad click to program contact in a digital ad campaign for early psychosis intervention
Test Unified Local PPC Across All Locations
Experience seamless local PPC execution and data-driven insights for every site before committing.
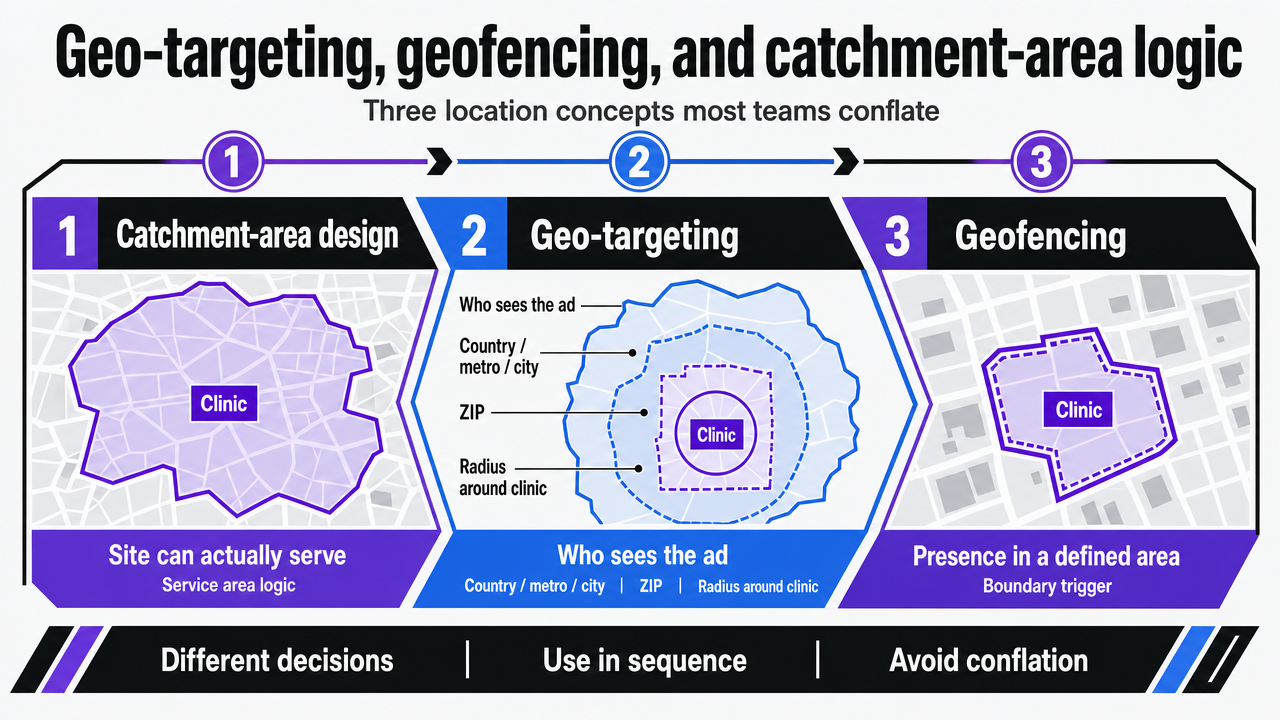
Geo-targeting, geofencing, and catchment-area logic
Three location concepts most teams conflate
Geo-targeting, geofencing, and catchment-area design get used interchangeably in vendor decks and agency reports. They describe three different decisions, and conflating them produces budgets that miss the patients a site can actually serve.
Geo-targeting : Defines who sees an ad based on location attributes — country, metro, city, ZIP code, or a radius around a coordinate. A Boston University review of the practice frames it as marketing to a defined set of users by location and notes that the more relevant an ad is to a user, the more likely that user is to convert 4. For a dermatology group, geo-targeting is the layer that decides whether the Cleveland ad group serves to greater Cleveland, to specific ZIPs inside Cleveland, or to a five-mile ring around the clinic itself.
Geofencing : Narrower. It uses precise boundary triggers — a competitor's parking lot, a hospital campus, an event venue — to fire ads or capture audiences when devices cross that perimeter. Geofencing is a tactic. Geo-targeting is the broader strategy that decides where ads are eligible to serve at all.
Catchment-area logic : A service-design concept, not an ad-platform setting. A 2025 study on primary healthcare accessibility frames catchment design as a response to spatial imbalances in service access — defining which populations a site can realistically serve given travel distance, road networks, and competing options 10. Catchment thinking sets the boundary the geo-target should respect. A behavioral health clinic with a 25-minute drive-time ceiling for adherence does not benefit from a 30-mile radius bid, even if the platform allows it.
Ordered correctly: catchment defines the service area, geo-targeting translates that area into platform settings, and geofencing applies surgical boundary tactics on top. Teams that skip the first step bid against patients who will never show up.
Designing radii against real patient travel behavior
Radius design is where catchment logic meets the bid. The default move — apply the same five- or ten-mile ring to every location — treats the footprint as uniform when it almost never is. A suburban urgent care in a low-density market may legitimately pull patients from twelve miles away. The same brand's downtown site competes with three urgent cares inside a two-mile walk and should not bid against the suburban ring.
Three inputs shape an honest radius:
- Drive-time data from the clinic's own appointment records — if 80% of booked patients live within fifteen minutes, the radius should reflect that, not a marketing assumption.
- Service-line sensitivity: a one-time procedure tolerates longer travel than a twelve-visit physical therapy plan, where adherence collapses past a certain commute.
- Competitive density — in markets where a competitor sits closer to a portion of the target ZIPs, bidding into that overlap wastes spend on clicks the competing site will convert.
The accessibility research on spatial allocation reinforces the same point from the service-delivery side: geographic allocation works when it matches real travel behavior to defined service areas rather than abstract distance rules 10. Operationally, that means radius settings should be reviewed against appointment ZIP data at least quarterly, with location-by-location overrides documented in the account naming convention rather than buried in a campaign-level setting no one audits.
 Visualize the sequential relationship between catchment-area design, geo-targeting, and geofencing, which the section explicitly orders as a three-step conceptual framework
Targeting versus tailoring across the ad and landing-page layer
Health communication research draws a clean line between two ideas operators routinely collapse. Targeting means writing one message for a defined subgroup. Tailoring means adjusting the message at the individual level. The peer-reviewed framework from Kreuter and colleagues argues that targeting is the efficient choice when behavior is relatively simple and individual-level data is thin, while tailoring earns its cost when the behavior is complex enough to justify the assessment burden 5. For a multi-location healthcare account, that distinction maps directly onto where customization should happen in the ad stack.
Geography is the targeting axis. A dermatology group does not need individual-level data to know that the Phoenix ad group should speak differently than the Minneapolis one — climate, dominant skin concerns, and seasonal demand curves diverge by market. That is subgroup logic, applied at the ad group level through localized headlines, callouts referencing the specific clinic, and call extensions routed to the right front desk. The campaign-and-ad-group architecture from earlier sections is what makes this scalable: one service-line campaign, twenty ad groups, twenty localized creative variants, no rebuild required.
Tailoring belongs on the landing page. Once a click lands, the page can adjust by referrer, device, time of day, or query intent without touching the ad account. A behavioral health network can serve the same Boston ad group's traffic into a page that surfaces telehealth availability for searches with mobile intent at 9 p.m., and in-person scheduling for desktop searches during business hours. The ad group did not change. The page did.
The trap is inverting the layers. Operators who try to tailor at the ad level — building dozens of near-duplicate ad groups to capture every micro-segment — collapse Quality Score signals, fragment learning across conversion data, and create a maintenance load that defeats the account-level model. Operators who refuse to localize at the ad level — running one national ad across every market — surrender the relevance advantage that geo-targeted creative produces, where higher local relevance correlates with higher conversion probability 4. Targeting at the ad group, tailoring at the page: the division of labor that lets a portfolio scale without exploding the build.
Centralize Local PPC Execution Across All Healthcare Locations
See how multi-location marketing teams streamline paid search campaigns, reduce per-location overhead, and achieve measurable efficiency gains with unified PPC management—backed by real-world healthcare benchmarks.
Governance: HIPAA authorization and FTC substantiation as account-level controls
Compliance is where multi-location PPC programs accumulate the most hidden risk, because the surface area scales with every location, every agency relationship, and every creative variant. The fix is to stop treating HIPAA and FTC obligations as per-campaign checklists and start treating them as account-level controls — enforced once, inherited everywhere.
HHS draws a clear line on what counts as marketing under HIPAA: with limited exceptions, written authorization is required before protected health information can be used or disclosed for marketing purposes 1. For a multi-location operator, the practical implication runs straight into remarketing. Audiences built from patient portal logins, appointment confirmation pages, or condition-specific landing pages can constitute PHI use the moment they are handed to an ad platform. The account-level control is a remarketing policy that defines which page categories are eligible for audience capture, which require authorization workflows, and which are prohibited outright — applied through tag governance, not left to each location's agency to interpret.
FTC substantiation runs parallel. The agency requires companies to support health advertising claims with solid proof 2. In a portfolio context, the failure mode is local creative drift: a single market's agency writes "clear skin in two weeks" or "90% patient satisfaction" into a responsive search ad, and that claim now runs under the brand's name with no documented evidence file behind it. The account-level control is a claims register — a centralized list of approved outcome language, satisfaction figures, and before/after framings, each tied to the underlying study, internal data, or clinical source that substantiates it. Ad copy reviews check against the register before publish, not after a complaint.
Both controls collapse the compliance review surface from N locations to one. That is the operating dividend: governance designed once, enforced at the layer where ads actually serve.
Measurement beyond platform metrics: appointments as the unit of truth
Clicks and impressions are inputs. The output that matters to a regional director is booked appointments, kept appointments, and the revenue that follows. Platform-reported conversions sit between the two, and treating them as the endpoint is where most multi-location measurement programs lose their grip on reality.
The Wharton case study on advertising effectiveness makes the methodological point directly: rigorous measurement tracks advertising exposures and the subsequent conversions of individual users, accounting for attribution and confounding rather than trusting platform-reported counts at face value 11. For a portfolio operator, that translates into three concrete commitments:
- Offline conversion import from the EHR or practice management system, so the appointment — not the form fill — becomes the conversion event Google Ads optimizes against.
- Call tracking with dynamic number insertion at the location level, so phone-driven appointments at an urgent care chain's busiest site are not invisible in the optimization signal.
- A defined lag window, so locations with longer booking cycles are not punished against locations where patients call the same day.
The HEALing Communities analysis of digital health campaign performance reinforces the same discipline from the campaign-evaluation side: examining tactics, platforms, and messaging against defined outcomes rather than against platform vanity metrics is what separates a real performance review from a slide deck 7. Channel mix and creative variants get assessed against the endpoint that matters, with local context treated as a variable rather than ignored.
What this looks like in practice is a measurement layer that reports four numbers per location, per service line, per month: cost per qualified lead, cost per booked appointment, cost per kept appointment, and contribution margin per kept appointment where the finance team can supply the denominator. Platform conversions become a leading indicator. Appointments become the unit of truth. When the VP of Marketing asks which markets are funding which markets, the data layer answers in the same vocabulary the CFO uses — not in click-through rates.
Centralize and Scale Local PPC Campaigns Across Every Location
Gain direct access to an AI-driven platform that streamlines paid search execution, automates location-level optimizations, and enables unified PPC management for complex healthcare and enterprise footprints.
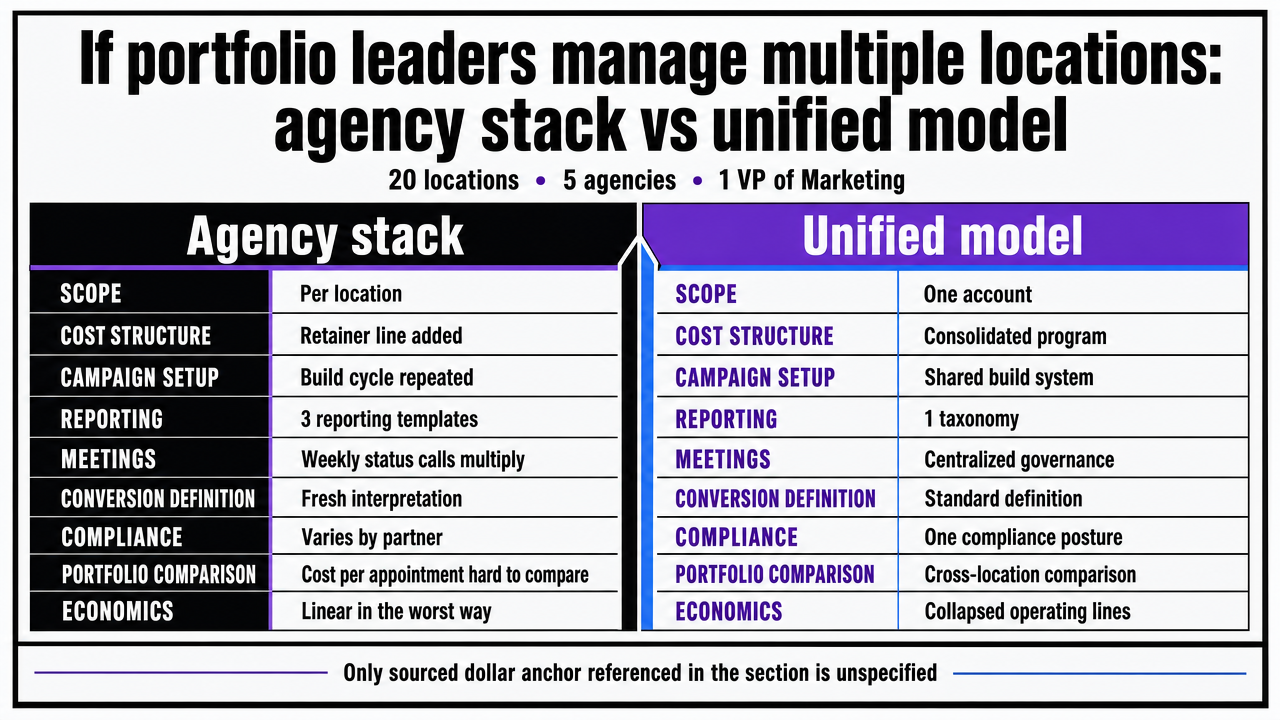
If portfolio leaders manage multiple locations: agency stack vs unified model
The shift in scope for this section: from tactical architecture to the economics that decide whether a portfolio operator keeps paying for parallel agency relationships or consolidates into a single account-level program. Twenty locations, five agencies, three reporting templates, and one VP of Marketing trying to compare cost per appointment across the footprint — that is the situation the comparison below is built for.
The economics of the agency-stack model are linear in the worst way. Each new location adds a retainer line, a campaign build cycle, a separate weekly status call, and a fresh interpretation of what counts as a conversion. The unified model collapses those lines into one account, one taxonomy, and one compliance posture. The only sourced dollar anchor available across the cited research is the $0.33 cost per click reported in the early psychosis intervention study, which applies to a single help-seeking clinical context and should not be projected onto dermatology or urgent care economics 3. Everything else in the table below uses transparent variables rather than invented figures.
| Dimension | Per-location agency stack | Account-level unified model |
|---|---|---|
| Campaign build cadence | N builds per service-line launch | 1 build, N ad-group variants |
| Location-level reporting overhead | N templates, manual reconciliation | 1 schema, automated portfolio view |
| Conversion taxonomy consistency | Drifts across agencies over time | Defined once, enforced at tag layer |
| Compliance review surface area | N creative pipelines, N audit trails | 1 claims register, 1 remarketing policy |
| Cost structure | N × per-location retainer + media | Single account cost base + media |
| Sourced CPC anchor (narrow scope) | $0.33 CPC reported in early psychosis intervention study 3 |
The decision rule is not ideological. It is the point at which coordination cost across N agency relationships exceeds the cost of building the unified account itself — usually somewhere between ten and twenty sites, depending on service-line complexity and regional regulatory variation. Past that threshold, the agency stack keeps charging linearly while delivering sub-linear portfolio intelligence, because no single party in the stack is accountable for the cross-location view the VP of Marketing actually needs.
 Visualize the comparison table contrasting the per-location agency stack against the unified account model, which the section presents as a structured side-by-side decision framework
The shift from manual location management to continuous optimization
Manual location management assumes a cadence: weekly bid reviews, monthly creative refreshes, quarterly negative-keyword audits, per-location reporting decks assembled by hand. That cadence was built for the era when an analyst could reasonably hold a five-account portfolio in their head. At thirty or two hundred sites, the cadence becomes the ceiling — optimization happens on the human schedule, not on the demand curve.
McKinsey's 2025 technology outlook frames the underlying shift directly: equity investment increased across most tracked technology trends in 2024, with applied AI and advanced analytics among the categories drawing the most sustained capital, and marketing operations sitting squarely in the addressable surface 8. The relevant implication for a multi-location operator is not that AI will replace strategy. It is that the optimization loop — bid adjustments against booked-appointment data, creative rotation against location-level Quality Score signals, negative-keyword discovery against query reports, budget reallocation across service lines — can run continuously rather than on a weekly meeting cadence.
The same outlook notes that adoption speed and organizational capability gaps remain the binding constraints on realizing that potential 8. Operators who move first do not skip the architecture work in the earlier sections — they run it. One account, one conversion taxonomy, one compliance posture, and location-aware targeting are the preconditions for continuous optimization to mean anything. Without that foundation, automated bidding optimizes against noise. With it, every location inherits the same learning rate from every other location in the portfolio, and the management model finally scales the way the footprint does.
Frequently Asked Questions
References
- 1.Marketing | HHS.gov.
- 2.Health Claims | Federal Trade Commission.
- 3.Using Digital Media Advertising in Early Psychosis Intervention.
- 4.The Power of Geo-Targeting.
- 5.Targeting or Tailoring? Maximizing Resources to Create Effective Health Communications.
- 6.Digital Marketing for Private Practice: How to Attract New Patients.
- 7.Health Communication Campaign Performance During the HEALing Communities Study.
- 8.McKinsey technology trends outlook 2025.
- 9.2025 Digital Media Trends | Deloitte Insights.
- 10.Strategies for enhancing PHC accessibility through mobile and geographic allocation approaches.
- 11.Case Study: Measuring Online Advertising Effectiveness.