
Key Takeaways
- Looker Studio Pro rebuilds the reporting layer with governance, version control, and per-project pricing, but still requires a warehouse someone else builds to answer harder measurement questions.
- Whatagraph undercuts per-client reporting economics with data-source pricing, making it cheaper for fewer, larger accounts, though attribution and incrementality testing remain out of scope.
- Funnel.io normalizes spend and conversion data across hundreds of sources into a unified dataset, enabling cross-channel attribution without requiring a dedicated data engineering team.
- Google Meridian collapses the access barrier to marketing mix modeling by releasing an open-source framework for privacy-resilient measurement, though walled-garden neutrality concerns remain 2.
- Improvado targets enterprise marketing organizations with managed connectors and white-glove implementation, functioning as partial outsourcing of marketing data engineering rather than a dashboard subscription.
- Triple Whale demonstrates why vertical-native measurement outperforms horizontal dashboards for DTC Shopify operators, handling iOS signal loss, creative-level performance, and LTV-aware bidding inputs.
- Vectoron-category execution platforms consume measurement signals and produce the work analysis recommends—briefs, bids, fixes, outreach—priced per account rather than per client or channel.
Why dashboard-first reporting stopped being the answer
AgencyAnalytics built its category by solving a real problem: getting a client-ready PDF out the door every Monday morning. That problem is largely solved. The harder one — connecting what the dashboard shows to what the team should do next — is where most growth operations now lose weeks of compounding return.
Forrester's 2026 guidance puts it plainly. Marketing leaders should "create and execute a measurement data strategy" and "follow a centralized and continuous measurement process" so that analysis becomes a recurring business driver rather than a reporting artifact 1. The distinction matters. A dashboard delivers a snapshot. A measurement process feeds budget shifts, channel reallocations, creative iterations, and production cycles on a continuous basis.
The operating gap shows up in three places:
- Reporting tools surface what happened, often siloed by channel.
- Measurement platforms model why it happened across channels.
- Execution layers act on the answer — adjusting bids, briefing content, requesting backlinks — without waiting for a Monday call.
Most agency analytics tools sit firmly in the first bucket and were never designed to leave it.
That is the lens this comparison uses. The seven alternatives below are not ranked by widget count or dashboard polish. They are sorted by where each one sits on the measurement-to-execution continuum, because that placement determines whether a tool reduces analyst hours, sharpens budget decisions, or produces the work the analysis recommends.
How to evaluate an alternative: the three-layer operating model
Forrester's 2023 Wave on marketing measurement and optimization was explicit about the criteria that separate leaders from laggards: analytics sophistication, modeling depth, and the ability to tie outputs to planning and forecasting rather than producing static dashboards 3. That framing translates cleanly into a three-layer operating model growth directors can use to sort the seven alternatives that follow.
Layer one — reporting. Pulls data from ad platforms, GA4, Search Console, and CRMs into client-ready views. Optimized for cadence, white-labeling, and stakeholder communication. Looker Studio Pro and Whatagraph live here. The job is to compress what happened into a digestible artifact. Pricing typically scales per client, per connector, or per seat.
Layer two — measurement. Normalizes data across channels and applies attribution, incrementality, or marketing mix modeling to answer why performance moved. Funnel.io, Google Meridian, Improvado, and Triple Whale operate here, each from a different angle — pipeline-first, model-first, enterprise-warehouse-first, or vertical-first. Outputs inform budget reallocation, not just reporting.
Layer three — execution. Consumes measurement signals and produces the work the analysis recommends: bid changes, content briefs, technical fixes, outreach lists. Pricing here is account-level rather than per-client because the unit of value is produced output, not displayed data.
Three questions sort any candidate into the correct layer:
- Does the tool surface data, model it, or act on it?
- Is pricing tied to dashboards delivered, channels modeled, or work produced?
- Does the output land in a PDF, a planning meeting, or a production queue?
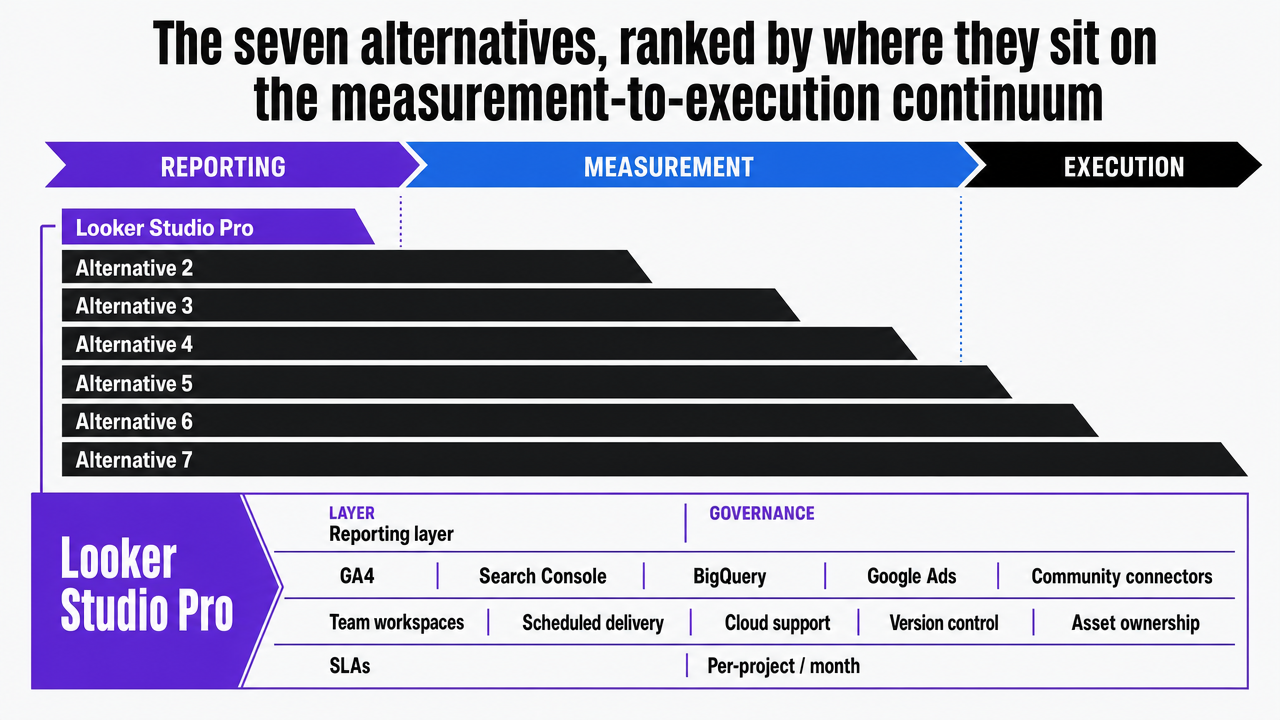
The matrix below maps each of the seven against those axes.
Seven AgencyAnalytics alternatives mapped across the reporting, measurement, and execution layers, with starting price tier and primary buyer. Evaluation axes follow Forrester Wave criteria emphasizing unified cross-channel measurement and outputs tied to planning and forecasting 3.
Test Automated Analytics and Reporting Workflows Instantly
Experience real campaign reporting and automated execution on your actual accounts during a fully enabled 7-day trial.
The seven alternatives, ranked by where they sit on the measurement-to-execution continuum
Looker Studio Pro — the reporting layer, rebuilt for governance
Looker Studio Pro is what AgencyAnalytics could have been if Google had cared about agency reporting earlier. It sits squarely in the reporting layer — pulling from GA4, Search Console, BigQuery, Google Ads, and a long tail of community connectors into dashboards that look enterprise-grade once a competent analyst spends a week on templates.
The Pro tier adds team workspaces, scheduled delivery, and Google Cloud support contracts, which matters less for visual polish and more for governance: version control on shared dashboards, asset ownership when someone leaves, and SLAs the IT organization can sign off on. Pricing runs per-project per-month rather than per-client, which inverts the AgencyAnalytics economics for shops managing fewer accounts but deeper data needs.
The honest limitation is that Looker Studio remains a visualization layer over warehouses someone else has to build and maintain. It does not normalize naming conventions across ad accounts, does not model attribution, and does not flag when a campaign result is statistically meaningless. Forrester's framework for marketing analytics is explicit that dashboards must demonstrate contribution to growth for finance stakeholders 10— Looker Studio enables that conversation, but only if the warehouse behind it already answers the question.
Whatagraph — agency reporting without the per-client tax
Whatagraph competes directly with AgencyAnalytics on the same operating model: client-ready reports, white-labeled output, and a connector library covering the ad platforms and SEO tools most agencies live in. The differentiator is pricing structure. Where AgencyAnalytics scales by client count, Whatagraph leans on data-source pricing and report volume, which favors agencies running fewer, larger accounts over those churning through dozens of small retainers.
The platform handles the reporting cadence well — automated PDF and live-link delivery, branded portals, cross-account data blending without writing SQL. For SaaS growth teams running a single instance with multiple acquisition channels, the per-source model can come out materially cheaper than per-client tools repurposed for internal use.
What Whatagraph does not solve is the measurement-to-execution gap. It is faster, cleaner reporting infrastructure, not a measurement platform. Attribution modeling is shallow, incrementality testing is absent, and there is no production layer downstream of the dashboard. Teams that find their bottleneck is producing the Monday report get real time back. Teams whose bottleneck is deciding what to do with the Monday report will land here and immediately need a second tool.
Funnel.io — the measurement layer for cross-channel attribution
Funnel.io moves the conversation up a layer. The platform's core job is data normalization — pulling spend, impression, click, and conversion data from hundreds of sources into a unified model where campaign naming, currency, and conversion definitions actually line up across channels. That sounds like plumbing, and it is, but it is the plumbing that makes cross-channel attribution possible without a data engineering team.
Once the data is normalized, Funnel feeds downstream destinations: BigQuery, Snowflake, Looker, Tableau, Google Ads for offline conversion uploads. The output is not a dashboard. It is a clean, modeled dataset other tools and analysts can interrogate. For growth directors trying to answer questions like "what did paid social actually contribute when controlling for branded search," that foundation is the prerequisite.
Forrester's Wave on measurement and optimization emphasized that leading platforms support unified measurement across channels and tie outputs to planning and forecasting rather than producing static dashboards 3. Funnel does the unification half cleanly. The modeling half still requires either an in-house analyst applying attribution logic in the warehouse, or a downstream tool like Meridian or a paid MMM vendor. Pricing scales with data volume and connectors, which makes it expensive for small accounts and proportionally cheap for teams running serious media budgets.
Google Meridian — open-source MMM enters the agency stack
Meridian is the entry on this list that most changes what "analytics alternative" means. Marketing mix modeling has historically been a six-figure engagement with specialist vendors — months of data collection, a custom Bayesian model, and a deck delivered quarterly. Meridian collapses the access barrier by releasing an open-source MMM framework that any team with a competent data scientist can run against their own media data.
Forrester's analysis positions Meridian as targeting the "need for privacy-resilient measurement" while still offering strategic insight into media effectiveness 2. That framing matters for two reasons. First, MMM works on aggregated data, which sidesteps the third-party cookie and consent constraints that broke pixel-based attribution for many channels. Second, it gives in-house teams a defensible model for budget allocation conversations with finance — the conversation that dashboards alone rarely settle.
The caveats Forrester flags in the same coverage are real. Meridian comes from a walled-garden operator, which raises questions about neutrality when the model is allocating credit between Google channels and everything else, and about cross-platform comparability when other walled gardens publish their own modeling frameworks 2. Most growth teams will not run Meridian directly. They will consume it through a measurement vendor that wraps the model in tooling, validation, and a consulting layer. The category implication is what matters: a model-driven measurement capability that used to anchor a $200K engagement is now a free repository, and any analytics tool that cannot ingest or complement MMM output is going to look thin against the alternatives that can.
Meridian repositions MMM from a specialist vendor engagement to an open-source capability addressing the "need for privacy-resilient measurement," with Forrester also flagging walled-garden neutrality concerns when modeling cross-platform media effectiveness 2.
Improvado — the enterprise data pipeline play
Improvado overlaps with Funnel on the data normalization job but targets a different buyer: enterprise marketing organizations and large agencies with dedicated analytics engineering capacity. The platform offers managed connectors at higher volume, custom transformation logic, and white-glove implementation services that smaller tools do not provide.
The trade-off is implementation weight. Where Funnel is roughly self-serve, Improvado deployments routinely involve a scoped onboarding engagement, custom schema work, and ongoing account management. That overhead is justified when the alternative is a four-person internal data team — and a tax when the team only needs three connectors and a dashboard. Pricing is custom and lands well above mid-market dashboard tools.
Forrester's roundup of marketing measurement service providers reinforces that the measurement layer increasingly bundles platform and services rather than selling pure software 8. Improvado fits that pattern. Growth directors evaluating it should treat the decision less as a tool purchase and more as a partial outsourcing of marketing data engineering, with the strategic question being whether that capability is better built in-house, contracted to a measurement service provider, or split across both. The wrong framing is comparing its monthly cost to a reporting tool's subscription line.
Triple Whale — vertical-native measurement for commerce operators
Triple Whale is the only entry on this list built for a specific vertical, and it earns inclusion because the vertical-native approach exposes what a focused measurement layer can do that horizontal tools cannot. The platform is purpose-built for direct-to-consumer ecommerce on Shopify, with attribution logic, creative analytics, and post-purchase survey integration designed around the way DTC brands actually buy media and read results.
The product handles the messy parts of commerce attribution that generic tools punt on:
- iOS 14 signal loss
- the gap between platform-reported and Shopify-reported conversions
- creative-level performance at the ad-variant level
- LTV-aware bidding inputs
For commerce operators, that vertical depth replaces a stack of three or four general-purpose tools and a custom dashboard.
For SaaS growth teams or healthcare operators, Triple Whale is the wrong tool — the integrations, conversion models, and benchmarks are built around a buying motion that does not match either context. The reason it belongs in this comparison is the principle it demonstrates. A measurement platform that knows the vertical's data shape, conversion logic, and benchmark set delivers more decision support than a horizontal dashboard with the same connectors. Growth directors should ask whether a vertical-native option exists in their category before defaulting to a horizontal one.
Vectoron-category platforms — the execution layer
The seventh category is the one most comparison articles miss because it does not present as an analytics tool. Execution-layer platforms consume measurement signals — from GA4, Search Console, ad platforms, and increasingly MMM outputs — and produce the work the analysis recommends. Content briefs and drafts, bid adjustments, technical SEO fixes, backlink outreach targets, conversion experiments. The dashboard exists, but it is the byproduct of execution, not the product itself.
The economic argument for this layer is straightforward. McKinsey's analysis of healthcare service operations notes that 45% of customer care operations leaders identified deploying the latest technology, including AI, as a top priority — a signal that the bottleneck has shifted from data access to operational throughput 5. The same logic applies to marketing. Most growth teams do not have a measurement problem severe enough to justify a six-figure MMM engagement. They have an execution problem: the analysis already points at content gaps, underweighted keywords, or paid accounts running stale, and there is no capacity to act on it without a retainer or new headcount.
Pricing in this category is account-level rather than per-client or per-channel, because the unit of value is produced output. Vectoron is one example of this category, sold to multi-location healthcare operators, agencies, and SaaS growth teams as a single-account program rather than a reporting subscription. The category question for growth directors is whether the next dollar buys more visibility into a problem the team already understands, or capacity to fix it.
 Map all seven AgencyAnalytics alternatives across the three-layer operating model (reporting, measurement, execution) as established in the preceding section, giving readers a single comparative reference for the detailed reviews that follow
The healthcare exception: why HIPAA changes the shortlist
This section applies to multi-location healthcare operators and the agencies that serve them. Growth directors outside healthcare can skim it. The constraint described below removes several otherwise-viable tools from the shortlist entirely, and it does so before any feature comparison runs.
The HHS bulletin on online tracking is the operative document. It states that tracking technologies used by covered entities and business associates can collect and analyze information about how users interact with websites and apps, and that data flowing through those technologies may constitute protected health information when it relates to an individual's health, care, or payment for care 4. The practical translation: any analytics tool that pipes raw GA4 events, ad-platform conversion pixels, or session-level identifiers into an external dashboard without a business associate agreement and a vetted data flow creates exposure. Most dashboard-first reporting tools were built before this guidance and have not re-architected around it.
The HIPAA Security Rule layers a second constraint on top. It establishes national security standards to protect health information maintained or transmitted in electronic form 6, which means the analytics vendor's storage, transmission, and access controls become part of the operator's compliance perimeter — not the vendor's problem to handle independently. A signed BAA is the floor, not the ceiling.
Three filters narrow the shortlist for healthcare operators:
- Does the vendor sign a BAA and document the data flows that BAA covers?
- Does the tool support server-side or aggregated data collection so that identifiers tied to appointment requests, condition pages, or provider searches do not leave the operator's controlled environment as raw events?
- Does pricing and architecture scale to coordinated measurement across locations without forcing per-site pixel implementations that multiply the exposure surface?
Tools that cannot answer all three drop off the list regardless of dashboard quality.
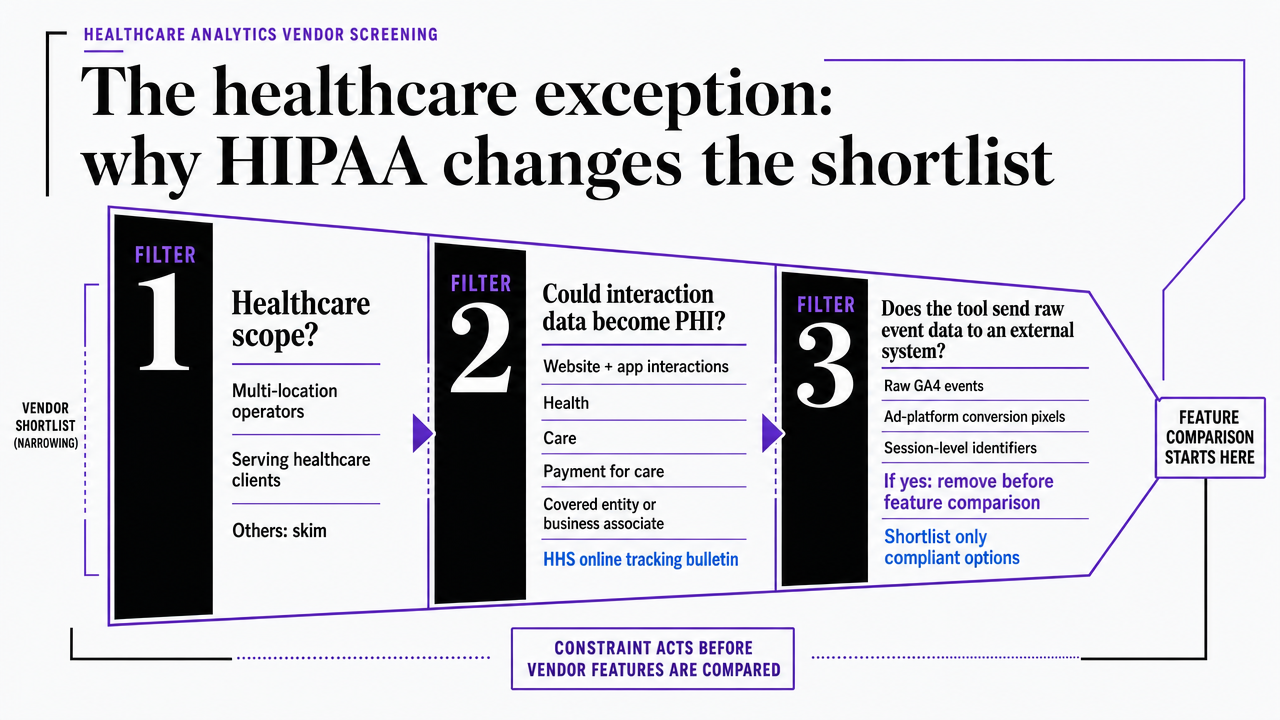 Visualize the three sequential filters healthcare operators must apply to any analytics vendor shortlist, as enumerated in the section's closing paragraph
See How Leading Teams Replace Agency Analytics for Streamlined Growth Reporting
Connect with our solutions team to benchmark your analytics stack against autonomous alternatives for unified PPC, SEO, and content reporting—no account managers or retainer fees required.
If you manage multiple locations: per-location dashboards vs. account-level execution
This section is for operators running ten, fifty, or two hundred locations under one growth program — multi-site healthcare groups, franchise systems, and regional service brands. Single-location SaaS readers can skip ahead.
Per-location pricing is the structural problem buried inside dashboard-first tools. AgencyAnalytics-style vendors typically meter by client or campaign instance, which means a fifty-location group either pays fifty client fees or collapses everything into one obscured rollup that defeats the point of location-level reporting. Forrester's marketing analytics framework is direct that dashboards should demonstrate contribution to growth for finance stakeholders 10. A line item that scales linearly with sites — without scaling decision quality — is the conversation finance will lose patience with first.
Account-level execution inverts the unit. One program covers every location, every service line, every channel, with output measured in produced work rather than dashboards delivered. The compact below uses only verified figures.
| Model | Pricing unit | Cost behavior at 25 locations | Output |
|---|---|---|---|
| Per-location reporting | Per client/site/month | Scales linearly | Dashboards delivered |
| Account-level execution | Per account/month (e.g., $599 trial tier) | Flat across sites | Content, bids, fixes shipped |
The question for multi-location directors is not which dashboard renders cleanest. It is whether the next marginal dollar buys another row of charts or another batch of executed work.
Matching tool to operating model: a finance-facing decision frame
Growth directors lose tool-switch arguments to finance when the pitch sounds like a feature upgrade. They win when the pitch maps spend to a layer of the operating model finance already recognizes — reporting, measurement, or execution — and shows what each layer returns.
Forrester's framework on marketing analytics is direct that dashboards must demonstrate contribution to growth in terms finance and other stakeholders can act on, not just visuals marketing teams enjoy 10. That translates into three line items, each with a different defensible ROI.
Reporting-layer spend defends on analyst hours saved and stakeholder cadence kept. Looker Studio Pro and Whatagraph belong on this line. The number to bring is hours reclaimed per reporting cycle, multiplied by loaded analyst cost.
Measurement-layer spend defends on budget reallocation quality. Funnel.io, Meridian-wrapped vendors, Improvado, and Triple Whale belong here. The number to bring is the size of the media budget being modeled and the percentage swing the model justifies — a 5% shift on a $2M annual budget is the conversation, not the subscription fee.
Execution-layer spend defends on produced work that would otherwise require headcount or a retainer. The number to bring is the fully-loaded cost of the work shipped, set against the platform's account-level fee.
See Real-Time, Multi-Channel Analytics—No Agency Bottlenecks Required
Access a unified analytics dashboard that benchmarks campaign performance, automates reporting, and enables instant optimization across all client accounts—purpose-built for agencies managing complex growth portfolios.
Operator synthesis: what to buy, what to retire, what to build around
The seven alternatives sort cleanly once the operating model is the question.
- Retire the per-client reporting tool when the bottleneck is decision quality, not delivery cadence.
- Buy at the reporting layer only when analyst hours are the constraint and the warehouse already answers the harder questions.
- Buy at the measurement layer when the media budget is large enough that a modeled 5% reallocation outweighs the subscription by an order of magnitude.
- Buy at the execution layer when the analysis already points at unshipped work and the next dollar should produce it.
Forrester's 2026 guidance frames the build-around correctly: a centralized, continuous measurement process combined with internal and external capabilities, not a single tool 1. Most growth programs will run two layers concurrently — a measurement spine plus either reporting for stakeholder cadence or execution for produced output. For multi-location healthcare operators evaluating that second slot, Vectoron sits in the execution category at an account-level price. The synthesis question is not which dashboard wins. It is which layer the next hire, retainer, or subscription belongs to.
Frequently Asked Questions
References
- 1.Navigate 2026 With A Measurement-Centered Marketing Culture.
- 2.Google Announces Meridian, A Marketing Mix Modeling Tool.
- 3.Marketing Measurement And Optimization, Q3 2023.
- 4.Use of Online Tracking Technologies by HIPAA Covered Entities and Business Associates.
- 5.Reimagining healthcare industry service operations in the age of AI.
- 6.Summary of the HIPAA Security Rule.
- 7.Setting the revenue cycle up for success in automation and AI.
- 8.The Latest And Greatest Marketing Measurement Service Providers.
- 9.Invest In Demand-Side Platforms To Lift Productivity And Performance.
- 10.Use Marketing Analytics To Support Your 2023 Marketing Strategy.